Contrastive Conceptor Activation Steering (COAST)
Unlocking Vision-Language-Action Models through Hidden States
Real-Robot Rollouts: \(\pi_{0.5}\) Before and After Steering
Pick a task to compare the frozen \(\pi_{0.5}\)-DROID policy’s own rollout with the same policy steered by COAST. The conceptor for each task is fit from the 15 base-policy trials; nothing else changes between the two clips. Below each comparison are all successful steered trials from the 15-trial evaluation. Clips show the two external ZED cameras and the wrist camera side by side and are played at 2× speed.
All successful \(\pi_{0.5}\)+COAST trials 5 videos · 6 of 15 trials succeeded (video recording failed for one success)
All successful \(\pi_{0.5}\)+COAST trials 7 videos · 7 of 15 trials succeeded
All successful \(\pi_{0.5}\)+COAST trials 13 videos · 13 of 15 trials succeeded
Clips are unedited rollouts from the 15-trial evaluation, played at 2× speed. Full protocol, per-task hyperparameters, and confidence intervals are in the Real-Robot Results section.
Real-Robot Results
We test on the DROID platform with the released \(\pi_{0.5}\)-DROID policy, which was not fine-tuned on any demonstrations of these tasks. The tasks have very different dynamics: opening, closing, and pick-and-place. Across the three main tasks, \(\pi_{0.5}\)+COAST achieves the highest success rate with a 40% average absolute improvement, and the largest gain on the challenging Open Drawer task. On Close Microwave, the success conceptor was fit from a single successful base-policy episode.
| Task | Fitting S/F | \(\pi_{0.5}\) [95% CI] | \(\pi_{0.5}\) + COAST [95% CI] | Gain |
|---|---|---|---|---|
| Open Drawer | 5/10 | 0.33 (5/15) [0.15, 0.58] | 0.86 (13/15) [0.62, 0.96] | +0.53 |
| Close Microwave | 1/14 | 0.07 (1/15) [0.01, 0.30] | 0.46 (7/15) [0.25, 0.70] | +0.39 |
| Put Duck in Cabinet | 2/13 | 0.13 (2/15) [0.04, 0.38] | 0.40 (6/15) [0.20, 0.64] | +0.27 |
15 trials per task and condition; brackets are Wilson 95% confidence intervals. “Fitting S/F” is the success/failure split of the 15 base-policy rollouts used to fit the conceptor. With 15 trials the intervals are wide, and base and COAST intervals are disjoint only for Open Drawer. The mean absolute gain is +0.40 over the three tasks. \(\pi_0\)-FAST and GR00T N1.5 reach at most 0.26 on any of the three main tasks.
Real-world evaluation: protocol, calibration data, and hyperparameters Extended appendix
We use the DROID robot setup, which consists of a 7-DoF Franka Emika Panda arm, a Robotiq 2F-85 parallel-jaw gripper, a wrist-mounted ZED Mini RGB-D camera, and two side-mounted ZED 2 stereo cameras. This setup enables the generalist \(\pi_{0.5}\)-DROID checkpoint to be run directly; the policy is the released checkpoint and is not fine-tuned on any demonstrations of the evaluated tasks. Activations are captured from the action expert’s residual stream at layers \(\{0, 5, 11, 17\}\) during every inference call.
Evaluation protocol
| Platform | DROID: 7-DoF Franka Emika Panda, Robotiq 2F-85 gripper, wrist ZED Mini and external ZED 2 |
| Policy | \(\pi_{0.5}\)-DROID, not fine-tuned on any demonstrations of these tasks |
| Control | Joint velocity and gripper position at 15 Hz |
| Action chunk | 10 actions × 8 dims (7 joint velocities + 1 gripper) |
| Open-loop horizon | 8 of 10 actions executed per replan (about 0.53 s) |
| Cameras to policy | 1 external ZED (left) + wrist, resized with padding to 224 × 224 |
| Activation capture | Residual stream at layers \(\{0, 5, 11, 17\}\); tensor of (10 denoising steps, 4 layers, 15 action tokens, \(d=1024\)) per inference call |
| Trials | 15 evaluation trials per task and condition; the 15 base-policy trials are also the fitting rollouts |
| Scene | Target-object placements kept as consistent as possible across trials and conditions |
Per-task calibration data and hyperparameters
For each task, the 15 base-policy trials serve both as the baseline measurement and as the fitting rollouts for COAST; no additional data collection is required. The table lists the language prompt, episode horizon, and the selected steering layer, aperture \(\alpha\), and strength \(\beta\) for every task. The success/failure split of the fitting rollouts is the “Fitting S/F” column above.
| Task | Layer | \(\alpha\) | \(\beta\) | Prompt | Max timesteps |
|---|---|---|---|---|---|
| Open Drawer | 5 | 5.0 | 0.2 | “open upper left drawer” | 700 |
| Close Microwave | 5 | 3.5 | 0.1 | “close the microwave door tightly” | 500 |
| Put Duck in Cabinet | 5 | 0.2 | 0.1 | “put duck on cabinet” | 200 |
Scope of the real-world evidence
On Close Microwave, the success conceptor is fit from a single successful base-policy episode.
This evaluation is deliberately reported with its limitations. It covers three tasks with 15 trials per condition in a single physical setup, and the confidence intervals are correspondingly wide: the base and COAST intervals are disjoint only for Open Drawer. The results should therefore be read as evidence that the simulation gains transfer to hardware on the evaluated tasks, not as an estimate of robustness across varied real-world scenes. All 15 COAST evaluation rollouts per task and the base-policy activations used for fitting are provided through an anonymized link in the supplementary material.
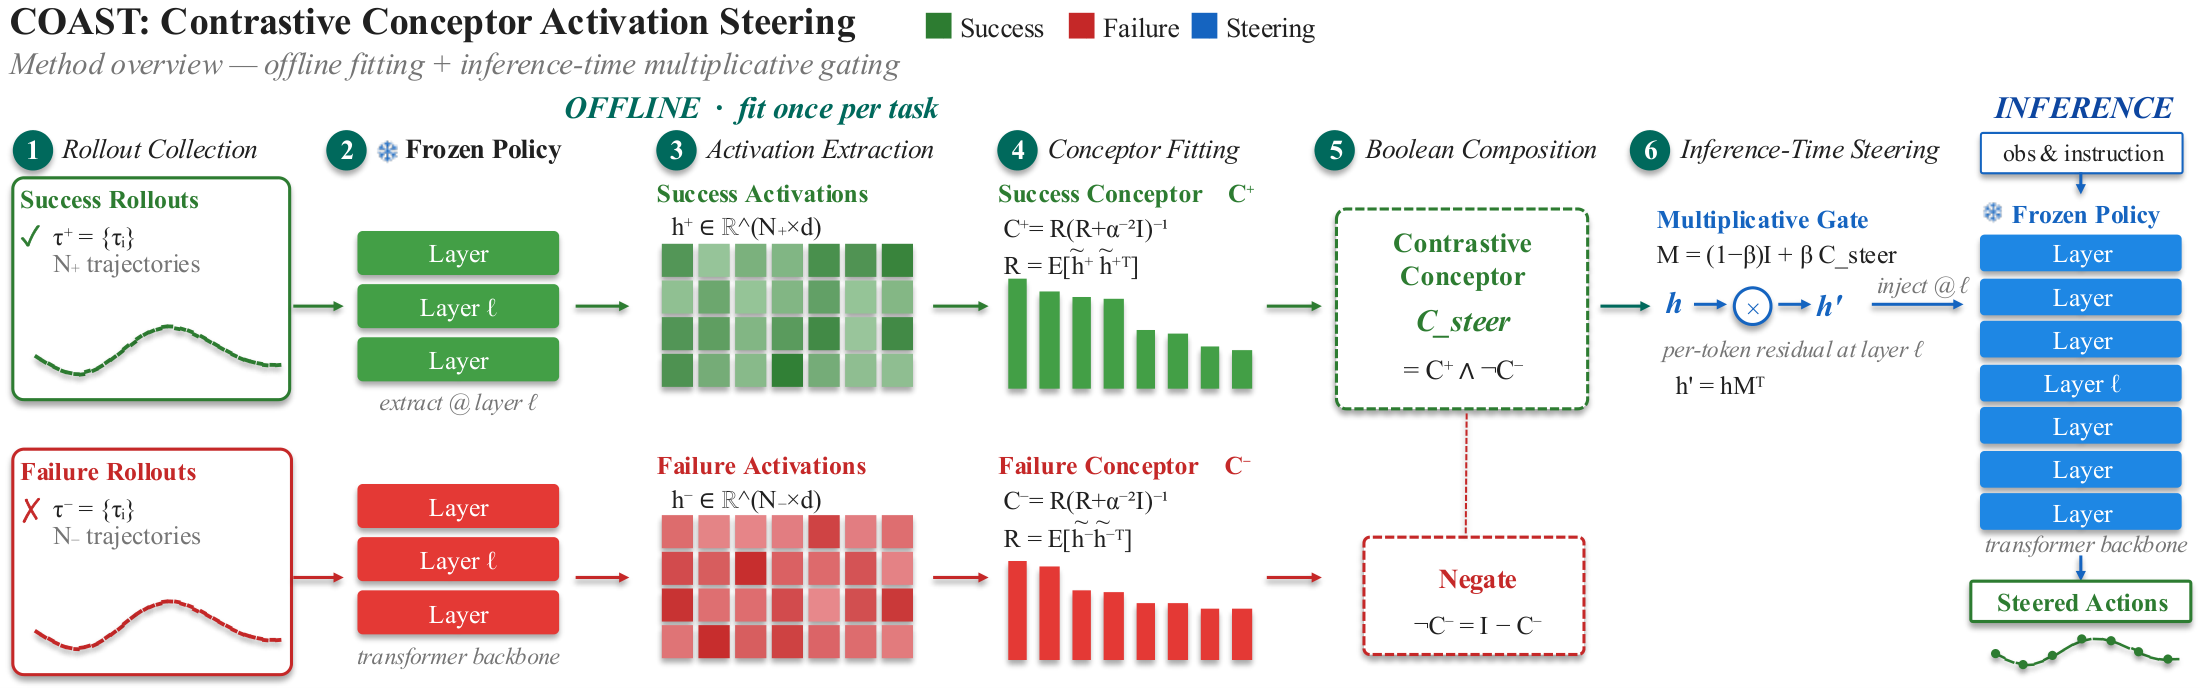
Experimental Setup

Policies
- \(\pi_{0.5}\) (flow-matching VLA): MetaWorld, LIBERO, RoboCasa, real robot
- \(\pi_0\)-FAST (autoregressive VLA): MetaWorld, LIBERO, real robot
- GR00T N1.5 (flow-matching VLA): RoboCasa, real robot
- Diffusion Policy (non-VLA diffusion baseline): RoboCasa
Protocol
- Strict train/test split: 15 fitting rollouts to build conceptors and choose hyperparameters, 30 held-out test rollouts with unseen environment configurations.
- Baselines: Contrastive Activation Addition (CAA), Sparse Autoencoder (SAE) steering, and LoRA supervised fine-tuning (SFT) on 30 on-policy rollouts per task, twice COAST’s fitting budget.
- Real robot: the released \(\pi_{0.5}\)-DROID checkpoint, not fine-tuned on any demonstrations of the evaluated tasks, 15 trials per task and condition.
Main Results
Across every model–benchmark pair, COAST produces statistically significant improvements over the unsteered policy, and the contrastive strategies (global and per-step) consistently outperform additive (CAA) and feature-based (SAE) steering as well as supervised fine-tuning. Gains are largest where the baseline is weakest.
| Benchmark | Policy | Base | +SFT | +SAE | +CAA | COAST Global | COAST Per-step | COAST Pos-only | Δ (best) |
|---|---|---|---|---|---|---|---|---|---|
| RoboCasa | \(\pi_{0.5}\) | 0.40 | 0.31 | 0.49 | 0.42 | 0.55 | 0.55 | 0.56 | +0.16 |
| RoboCasa | GR00T N1.5 | 0.59 | 0.50 | 0.69 | 0.62 | 0.75 | 0.71 | 0.73 | +0.16 |
| RoboCasa | Diffusion Policy | 0.32 | – | 0.42 | 0.36 | 0.45 | 0.46 | 0.39 | +0.14 |
| LIBERO-10 | \(\pi_{0.5}\) | 0.43 | 0.40 | 0.61 | 0.47 | 0.76 | 0.80 | 0.63 | +0.37 |
| LIBERO-10 | \(\pi_0\)-FAST † | 0.65 | 0.62 | 0.76 | 0.71 | 0.84 | 0.84 | 0.79 | +0.23 |
| MetaWorld ML45 | \(\pi_{0.5}\) | 0.69 | 0.53 | 0.77 | 0.79 | 0.94 | 0.94 | 0.81 | +0.25 |
| MetaWorld ML45 | \(\pi_0\)-FAST | 0.71 | 0.76 | 0.79 | 0.71 | 0.82 | 0.79 | 0.81 | +0.11 |
Mean success rate over tasks, each computed on 30 held-out test rollouts per task and condition. Bold marks the best method per row. Δ is the gain of the best COAST variant over the unsteered policy; all contrastive COAST gains are significant under a paired \(t\)-test across tasks (\(p<0.05\)). † One LIBERO task has zero failures under the \(\pi_0\)-FAST checkpoint, so that column’s mean and Δ are over the 9 contrastive-eligible tasks. Per-task results, \(p\)-values, and multiple-comparison corrections are in the paper.
Three patterns hold across all benchmarks and architectures
- Contrastive beats positive-only. Subtracting the failure subspace contributes meaningfully beyond projecting toward success.
- Per-step helps on long-horizon tasks. Per-step steering matches or exceeds global steering on LIBERO and RoboCasa but offers little extra on short-horizon MetaWorld, suggesting the discriminative subspace shifts during denoising mainly when multi-step reasoning is required.
- Gains scale inversely with baseline success. Tasks where the unsteered policy struggles most show the largest absolute improvements, e.g. LIBERO Mugs+Plates 0.07→0.60 and MetaWorld pick-place-wall 0.20→1.00 for \(\pi_{0.5}\).
SFT underperforms the base policy in five settings: fine-tuning on a strictly limited budget of 30 rollouts often overfits and degrades pre-trained robustness, and scaling SFT to 200 trajectories and 1,000 steps does not close the gap. CAA applies a strictly additive shift along a single direction, and SAE steering collapses selected features back into a single additive direction; neither performs the subspace-aware scaling that conceptors provide.
Extended Analyses
Two appendices from the full paper that are not in the arXiv version: a stronger fine-tuning baseline with a matched tuning protocol for the steering baselines, and three tests of whether COAST only helps undertrained policies.
Stronger fine-tuning baseline and matched tuning protocol for steering baselines Appendix B
SFT with 200 trajectories and up to 1,000 steps
The SFT baseline in the main results uses 30 on-policy rollouts per task and 200 LoRA steps. To test whether its underperformance is an artifact of a starved budget, we scale the same filtered-BC recipe to 200 on-policy rollouts per task for \(\pi_{0.5}\) on MetaWorld and train for up to 1,000 steps, evaluating merged checkpoints at 200, 500, 800, and 1,000 steps on 30 held-out test rollouts per cell. Successful episodes among the 200 rollouts become training samples. “Base” is the pooled base-policy success rate over the 200 collection rollouts and therefore differs from the 30-rollout test-set base in the main table.
| Task | Base | 200 | 500 | 800 | 1,000 | \(\Delta\) |
|---|---|---|---|---|---|---|
| coffee-push | 77.5 | 90 | 80 | 93 | 90 | +13 |
| faucet-close | 78.5 | 90 | 70 | 80 | 90 | +12 |
| disassemble | 54.0 | 53 | 13 | 53 | 63 | +9 |
| reach | 79.0 | 77 | 77 | 80 | 83 | +4 |
| pick-place | 69.5 | 90 | 70 | 67 | 73 | +4 |
| push | 87.5 | 87 | 80 | 87 | 87 | 0 |
| stick-push | 25.5 | 30 | 20 | 27 | 20 | −6 |
| coffee-pull | 91.0 | 83 | 90 | 70 | 77 | −14 |
| plate-slide-back | 54.0 | 3 | 13 | 37 | 43 | −11 |
| pick-place-wall | 39.5 | 10 | 13 | 10 | 3 | −37 |
| Mean | 65.6 | 61.3 | 52.6 | 60.4 | 62.9 | −2.7 |
Filtered-BC SFT with 200 on-policy rollouts per task, \(\pi_{0.5}\) on MetaWorld ML45 (success rate in %, 30 held-out test rollouts per cell). \(\Delta\) compares the 1,000-step checkpoint with the base policy.
Two findings stand out. First, more data and more steps do not close the gap: the best step count (1,000) still averages 2.7 points below the base policy, and performance is non-monotonic across steps (52.6% at step 500), indicating instability of the merged adapters at this data scale. Second, SFT regresses exactly where COAST gains most. SFT’s largest regression is pick-place-wall (39.5 → 3), the same task on which COAST produces its largest gain from only 15 rollouts (0.20 → 0.87 under global steering on held-out rollouts). Over the same ten tasks, COAST gains +0.25 from 15 rollouts.
We stress the scope of this comparison. It shows that COAST outperforms the evaluated LoRA-based filtered-BC recipe at two data budgets; it does not show that COAST is better than every way of updating the policy through training. We do not compare against other fine-tuning recipes or reinforcement-learning post-training, and claims about gradient-based adaptation should be read as relative to the evaluated SFT baseline.
CAA and SAE under COAST’s train/test protocol
In the main results, the CAA and SAE baselines selected their steering strength post hoc on the 30 held-out test rollouts, whereas COAST selected its configuration on the 15 fitting rollouts only. This asymmetry favors the baselines. To remove it, we re-ran CAA and SAE under COAST’s exact train/test protocol with wider hyperparameter grids, so that every method evaluates the same number of configurations per task:
- CAA: \(\alpha \in \{0.1, 0.25, 0.5, 0.75, 1.0, 1.5, 2.0, 3.0, 5.0\}\) (9 configurations per task);
- SAE: \(\alpha \in \{0.1, 0.25, 0.5, 0.75, 1.0, 1.5, 2.0, 3.0, 4.0\}\) (9 configurations per task);
- COAST: aperture \(\alpha \in \{0.1, 0.5, 1.0\}\) × strength \(\beta \in \{0.1, 0.3, 0.5\}\) (9 configurations per task).
All methods use the identical 15 base-policy rollouts for activation collection and hyperparameter selection, and are evaluated on the same 30 held-out rollouts.
| Suite | Base | +Global | +Per-step | +CAA (matched) | +SAE (matched) |
|---|---|---|---|---|---|
| \(\pi_{0.5}\) LIBERO-10 | 0.43 | 0.76 | 0.80 | 0.45 | 0.60 |
| \(\pi_{0.5}\) RoboCasa | 0.40 | 0.55 | 0.55 | 0.40 | 0.45 |
| GR00T N1.5 RoboCasa | 0.59 | 0.75 | 0.71 | 0.60 | 0.65 |
Mean success rate with CAA and SAE tuned under COAST’s train/test protocol (9 configurations per task per method). Under the matched protocol COAST’s margin over both baselines grows relative to the main results table, where CAA and SAE were tuned post hoc on the test set. The main table retains the original, post-hoc-tuned CAA and SAE numbers, which are an upper bound for those baselines; the matched-protocol numbers here are the like-for-like comparison.
SFT rollout budget
SFT uses \(N=30\) on-policy rollouts per task, twice the 15 rollouts available to COAST. Following the filtered-BC recipe, only action chunks from successful episodes are kept, so the effective training set is the success subset of those 30 rollouts. The larger rollout budget and the per-task LoRA fine-tune and merge give SFT a strict per-task advantage over the steering intervention. SFT’s underperformance in the main results therefore cannot be attributed to a starved baseline.
Does COAST only help undertrained policies? Appendix C
The largest absolute gains in the main results (MetaWorld and LIBERO) are obtained on early checkpoints chosen for mixed success/failure outcomes, whereas the fully trained RoboCasa checkpoints show gains of +0.14 to +0.16. A natural reading is that COAST mainly recovers undertrained competence. Three analyses test this reading.
Headroom analysis
We stratify all 60 task–model cells of the main results by baseline success rate and use the global contrastive column uniformly, with no per-task strategy selection. “Headroom recovered” is the gain divided by \((1 - \text{Base})\).
| Baseline stratum | Tasks | Base | +COAST (Global) | Gain | Headroom recovered |
|---|---|---|---|---|---|
| Base > 0.70 | 16 | 0.82 | 0.93 | +0.10 | 59% |
| 0.40 ≤ Base ≤ 0.70 | 29 | 0.58 | 0.81 | +0.22 | 54% |
| Base < 0.40 | 15 | 0.20 | 0.45 | +0.26 | 32% |
Gain and fraction of headroom recovered by COAST (global) as a function of baseline success rate, over the 60 task–model cells of the main results.
Absolute gains shrink as baselines rise because the available headroom shrinks. The fraction of headroom recovered, however, rises from 32% on low-baseline tasks to 59% on high-baseline tasks. If COAST only recovered undertrained competence, this fraction would fall on strong tasks; it does the opposite.
Fully trained checkpoints
All three RoboCasa checkpoints are fully trained production checkpoints. COAST adds +0.14 to +0.16 on each, all significant under the pooled \(z\)-test. On the GR00T N1.5 tasks whose baseline is already high (base \(\ge 0.67\): Close Fridge, PP Cabinet, PP Stove, Kettle), COAST adds +0.15 on average with zero regressions.
| Fully trained checkpoint | Base | +COAST | Gain | Significance |
|---|---|---|---|---|
| \(\pi_{0.5}\) RoboCasa (75k steps) | 0.40 | 0.56 | +0.16 | \(p_z = .009\) |
| GR00T N1.5 RoboCasa (120k steps) | 0.59 | 0.75 | +0.16 | \(p_z = .006\) |
| Diffusion Policy RoboCasa (epoch 1500) | 0.32 | 0.46 | +0.14 | \(p_z = .035\) |
COAST on fully trained RoboCasa checkpoints (global strategy for \(\pi_{0.5}\) and GR00T N1.5; per-step for Diffusion Policy).
We note that a fully trained checkpoint is not necessarily a near-state-of-the-art policy: the evaluated RoboCasa checkpoints reach 32–59% mean success, and COAST’s value on a policy that already succeeds on most tasks is tested here only through the high-baseline stratum above and the positive-only ablation on tasks with baseline \(\ge 0.67\) (in the full paper). RoboCasa is also a harder benchmark than MetaWorld and LIBERO-10 (randomized kitchen layouts, objects, textures, and lighting), so its absolute gains are not directly comparable with those on the easier suites.
Diffusion Policy epoch sweep and layer robustness
A natural concern is that the gains from steering could depend on a favorable checkpoint, layer, or hyperparameter choice rather than reflecting a robust, generalized effect. To rule this out, we evaluate our steering mechanism across multiple stages of training, intervention layers, and parameter grids, comparing COAST against both its unsteered base policy and internal baselines under the same evaluation protocol.
Setup. We consider five Diffusion Policy checkpoints saved at epochs 300, 600, 900, 1200, and 1500. For each checkpoint, we run the unsteered base policy on the 7 RoboCasa tasks and separately report the best steered result obtained from the same checkpoint under our steering sweep. This produces a per-epoch comparison between the base policy and its strongest steered variant. Importantly, the checkpoint set is fixed in advance and spans the training trajectory uniformly, ensuring the analysis does not rely on post hoc checkpoint cherry-picking. Additionally, to evaluate robustness across network depth, we swept over a grid of parameters for each method at every layer (0 to 11) for epoch 1500. For CAA we evaluated \(\alpha \in \{0.1, 0.5, 1.0\}\); for SAE steering \(\alpha \in \{0.5, 1.0, 2.0\}\); for COAST we swept aperture \(\alpha \in \{0.5, 1.0, 2.0\}\), steering strength \(\beta \in \{0.1, 0.3\}\), and strategy \(\in\) {global, per-step}, resulting in 12 candidate combinations per layer.
| Epoch | 300 | 600 | 900 | 1200 | 1500 (converged) |
|---|---|---|---|---|---|
| Base | 0.28 | 0.22 | 0.24 | 0.31 | 0.32 |
| +COAST | 0.35 | 0.33 | 0.35 | 0.43 | 0.49 |
| Gain | +0.07 | +0.11 | +0.12 | +0.12 | +0.16 |
| Tasks improved / regressed | 4/2 | 6/0 | 6/1 | 6/0 | 7/0 |
Diffusion Policy on RoboCasa across training epochs, aggregated over 7 tasks (\(n=210\) rollouts per cell). “Improved / regressed” counts tasks whose steered success rate is above / below the base checkpoint.
Three observations follow. (1) The gain grows monotonically with training, from +0.07 at epoch 300 to +0.16 at epoch 1500; the largest absolute gain occurs at the most converged checkpoint, not the least. (2) Regressions vanish as the policy converges: at epoch 300 two tasks degrade under steering, whereas at epoch 1500 all 7 tasks improve with zero regressions (one-sided sign test, \(p = .008\)). Steering is more reliable on a better-trained policy, because the behaviors it modulates are better formed. (3) Steering and training compose rather than substitute. Base performance is nearly flat from epoch 300 to 1500 (+0.046), while steering at epoch 300 already yields +0.07; the steered epoch-300 policy (0.35) outperforms the unsteered fully trained epoch-1500 policy (0.32), and the combination (0.49) exceeds either alone. Continuing to train these checkpoints is therefore not a substitute for steering.
| Task | 300 | 600 | 900 | 1200 | 1500 |
|---|---|---|---|---|---|
| CloseFridge | 0.57 → 0.53 | 0.27 → 0.30 | 0.40 → 0.47 | 0.40 → 0.43 | 0.43 → 0.60 |
| CoffeeSetupMug | 0.00 → – | 0.03 → 0.03 | 0.03 → 0.07 | 0.13 → 0.20 | 0.13 → 0.23 |
| OpenDrawer | 0.07 → 0.17 | 0.03 → 0.17 | 0.03 → 0.10 | 0.07 → 0.20 | 0.10 → 0.33 |
| OpenStandMixerHead | 0.60 → 0.83 | 0.63 → 0.87 | 0.57 → 0.80 | 0.53 → 0.87 | 0.63 → 0.87 |
| PickPlaceCounterToCabinet | 0.20 → 0.30 | 0.13 → 0.23 | 0.20 → 0.40 | 0.30 → 0.53 | 0.30 → 0.57 |
| PickPlaceCounterToStove | 0.13 → 0.10 | 0.07 → 0.10 | 0.10 → 0.07 | 0.13 → 0.13 | 0.10 → 0.13 |
| TurnOnElectricKettle | 0.37 → 0.50 | 0.40 → 0.63 | 0.33 → 0.57 | 0.60 → 0.67 | 0.57 → 0.67 |
Task performance across training steps: base → best steered configuration from the sweep, per Diffusion Policy checkpoint (epochs 300–1500). Bold marks cells where steering improves on the base checkpoint.
Results. The improvement from steering is not isolated to one stage of training. Across all evaluated epochs, the steered policy consistently matches or improves upon the corresponding base checkpoint. This is especially important because the absolute base performance varies substantially with the epoch, yet the relative advantage of steering remains present across the entire sweep.
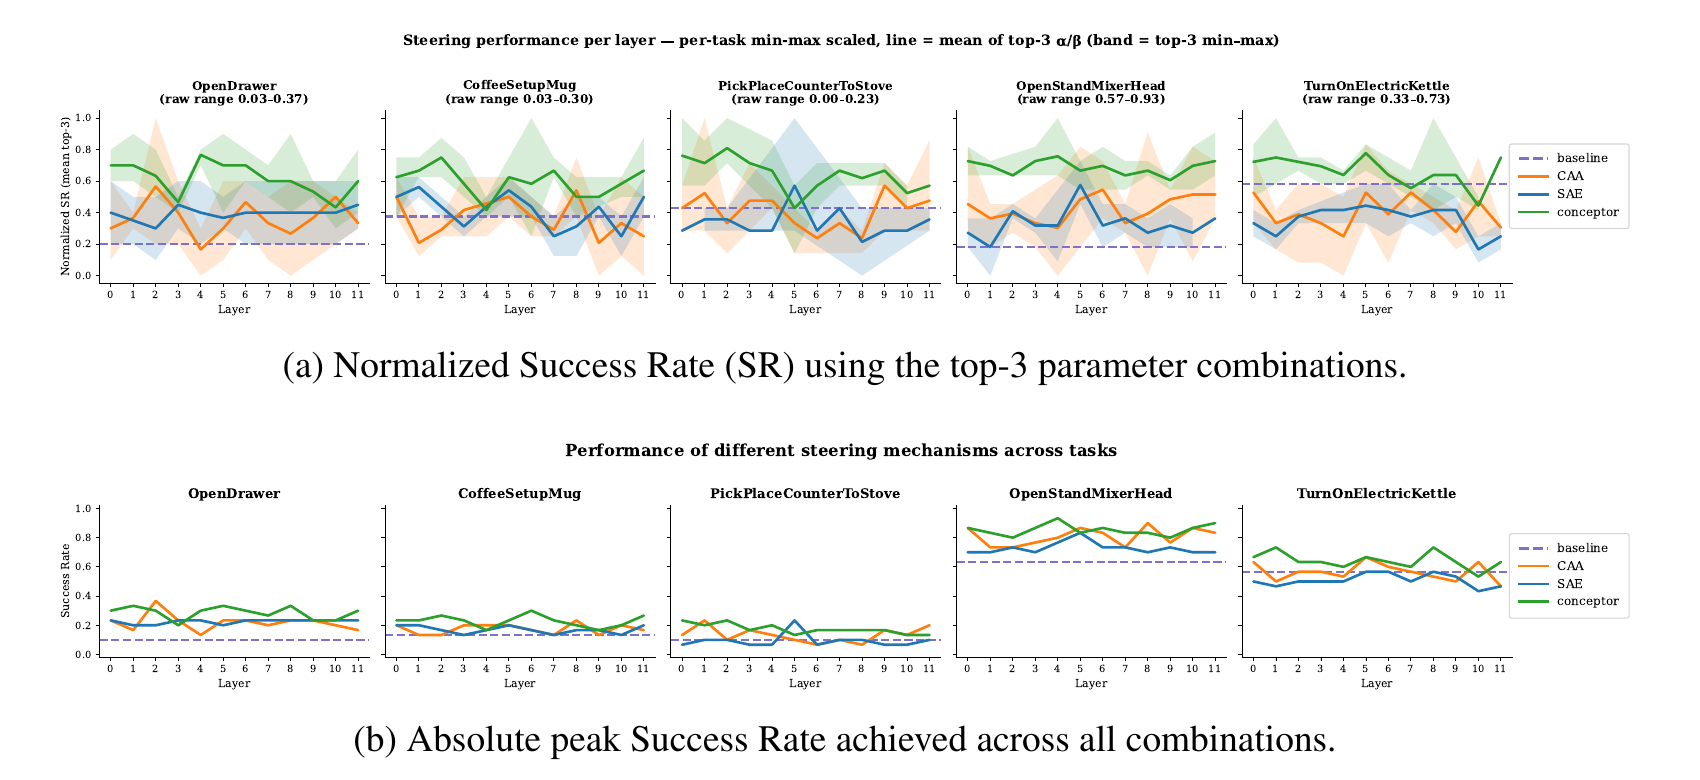
COAST demonstrates strong performance robustness across different model layers. Plotting the mean and variance of the top-3 parameter combinations at each layer (a) reveals that COAST not only achieves a higher normalized success rate than CAA and SAE across almost all layers, but also maintains a highly stable performance band. The absolute maximum success rate at each layer (b) shows that across five distinct RoboCasa tasks, COAST consistently outperforms the baselines, and the performance variance between adjacent layers is relatively small.
Discussion. These results strengthen the claim that the steering effect is genuine and broadly applicable. Because every checkpoint is evaluated independently against its own base model, the gains shown across early, middle, and late checkpoints confirm that the intervention is compatible with the learned policy throughout training. Similarly, the layer and hyperparameter analysis indicates that conceptor-based steering is not overly brittle or sensitive to the exact layer of intervention, provided our efficient hyperparameter selection heuristic is applied. Together, these findings demonstrate that COAST provides holistic, resilient improvements independent of specific model configurations.
Why Does a Closed-Form Gate Work?
We identify three geometric facts about the action expert’s hidden states that explain the double-digit gains.
1. Outcome-relevant computation is low-rank, but not rank-one
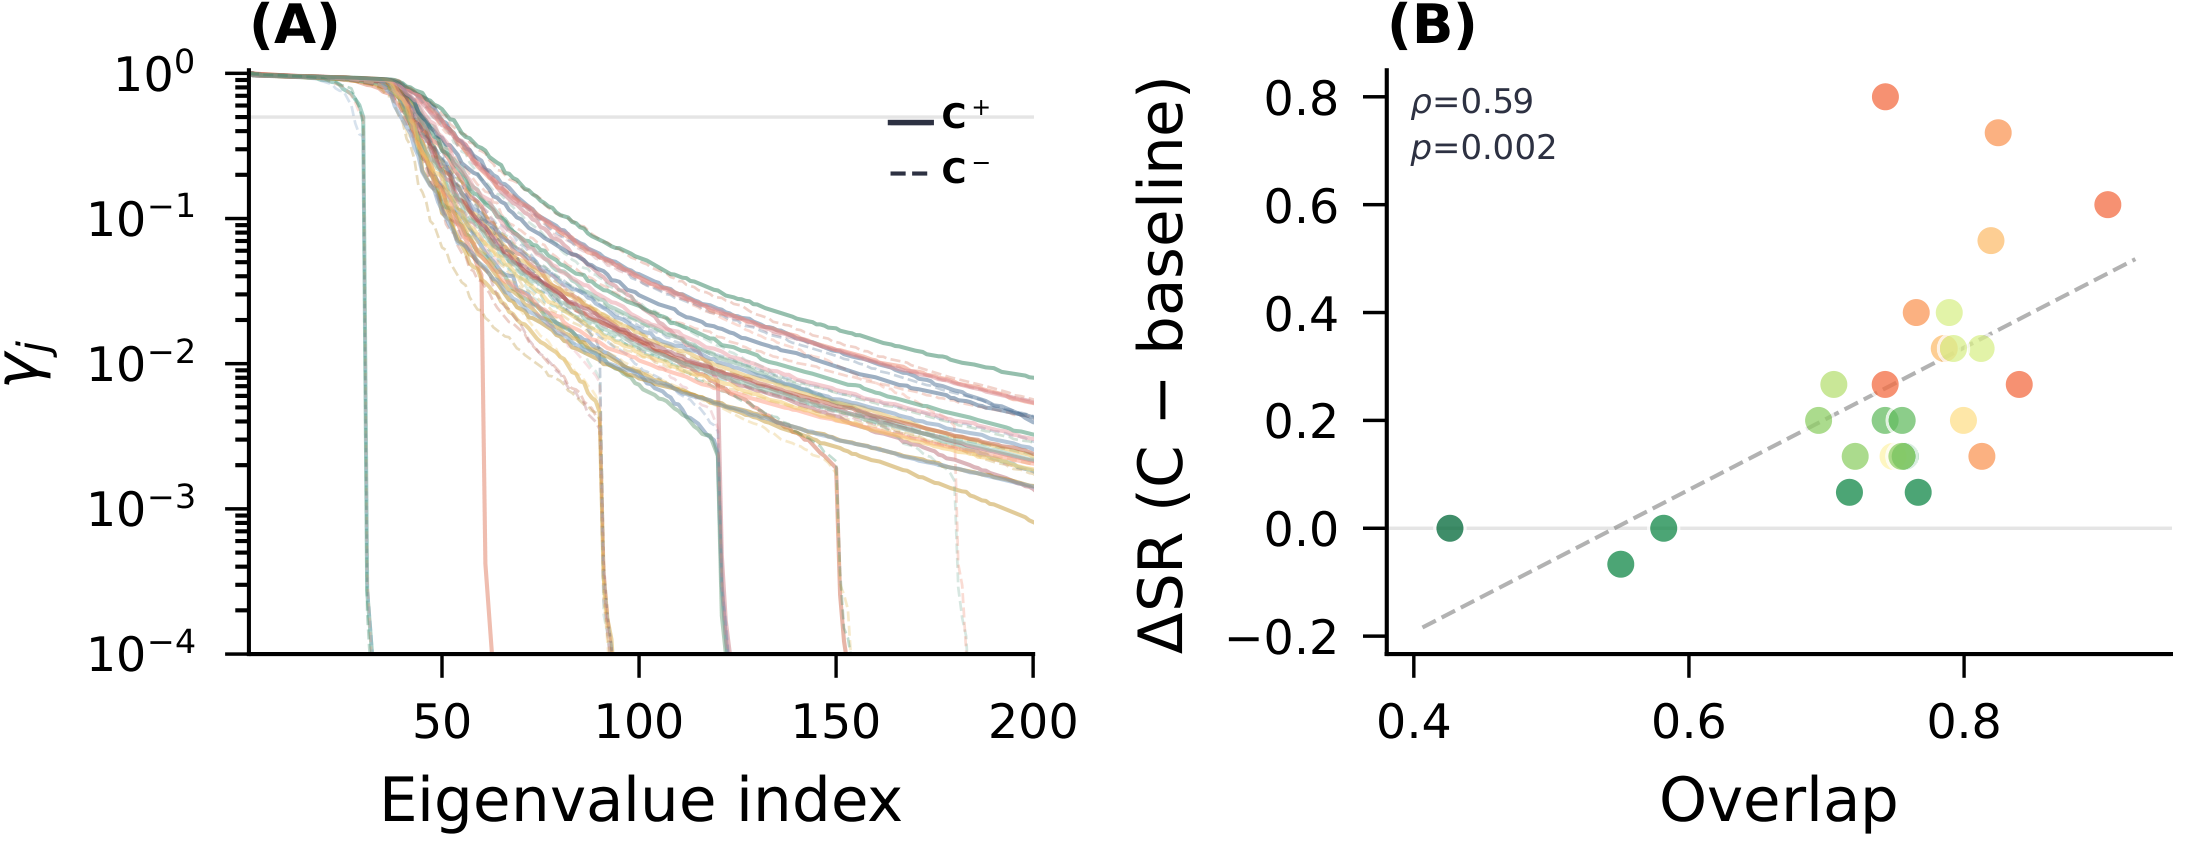
Although the \(\pi_{0.5}\) residual stream is 1024-dimensional, the eigenvalue spectra of both success and failure conceptors decay sharply across all steered MetaWorld tasks. The Boolean contrastive operation cancels the dimensions shared by both outcomes, reducing the effective steering subspace to roughly one percent of the hidden dimension. Yet this subspace is strictly multi-dimensional: additive steering along a single mean-difference vector (CAA) recovers only partial gains.
2. Subspace overlap predicts steering efficacy
Per-task gain correlates strongly with the success–failure overlap (Spearman \(\rho = 0.59\), \(p = 0.002\)),
$$\mathrm{sim}(C^{+}, C^{-}) = \frac{\mathrm{tr}(C^{+}C^{-})}{\sqrt{\mathrm{tr}((C^{+})^2)\,\mathrm{tr}((C^{-})^2)}}.$$When the subspaces overlap heavily, the thin residual directions distinguishing them are exactly what AND-NOT isolates. Overlap needs only one matrix product and no rollouts, so it doubles as a cheap diagnostic of where steering will help most.
3. Steering reshapes the activation geometry toward success
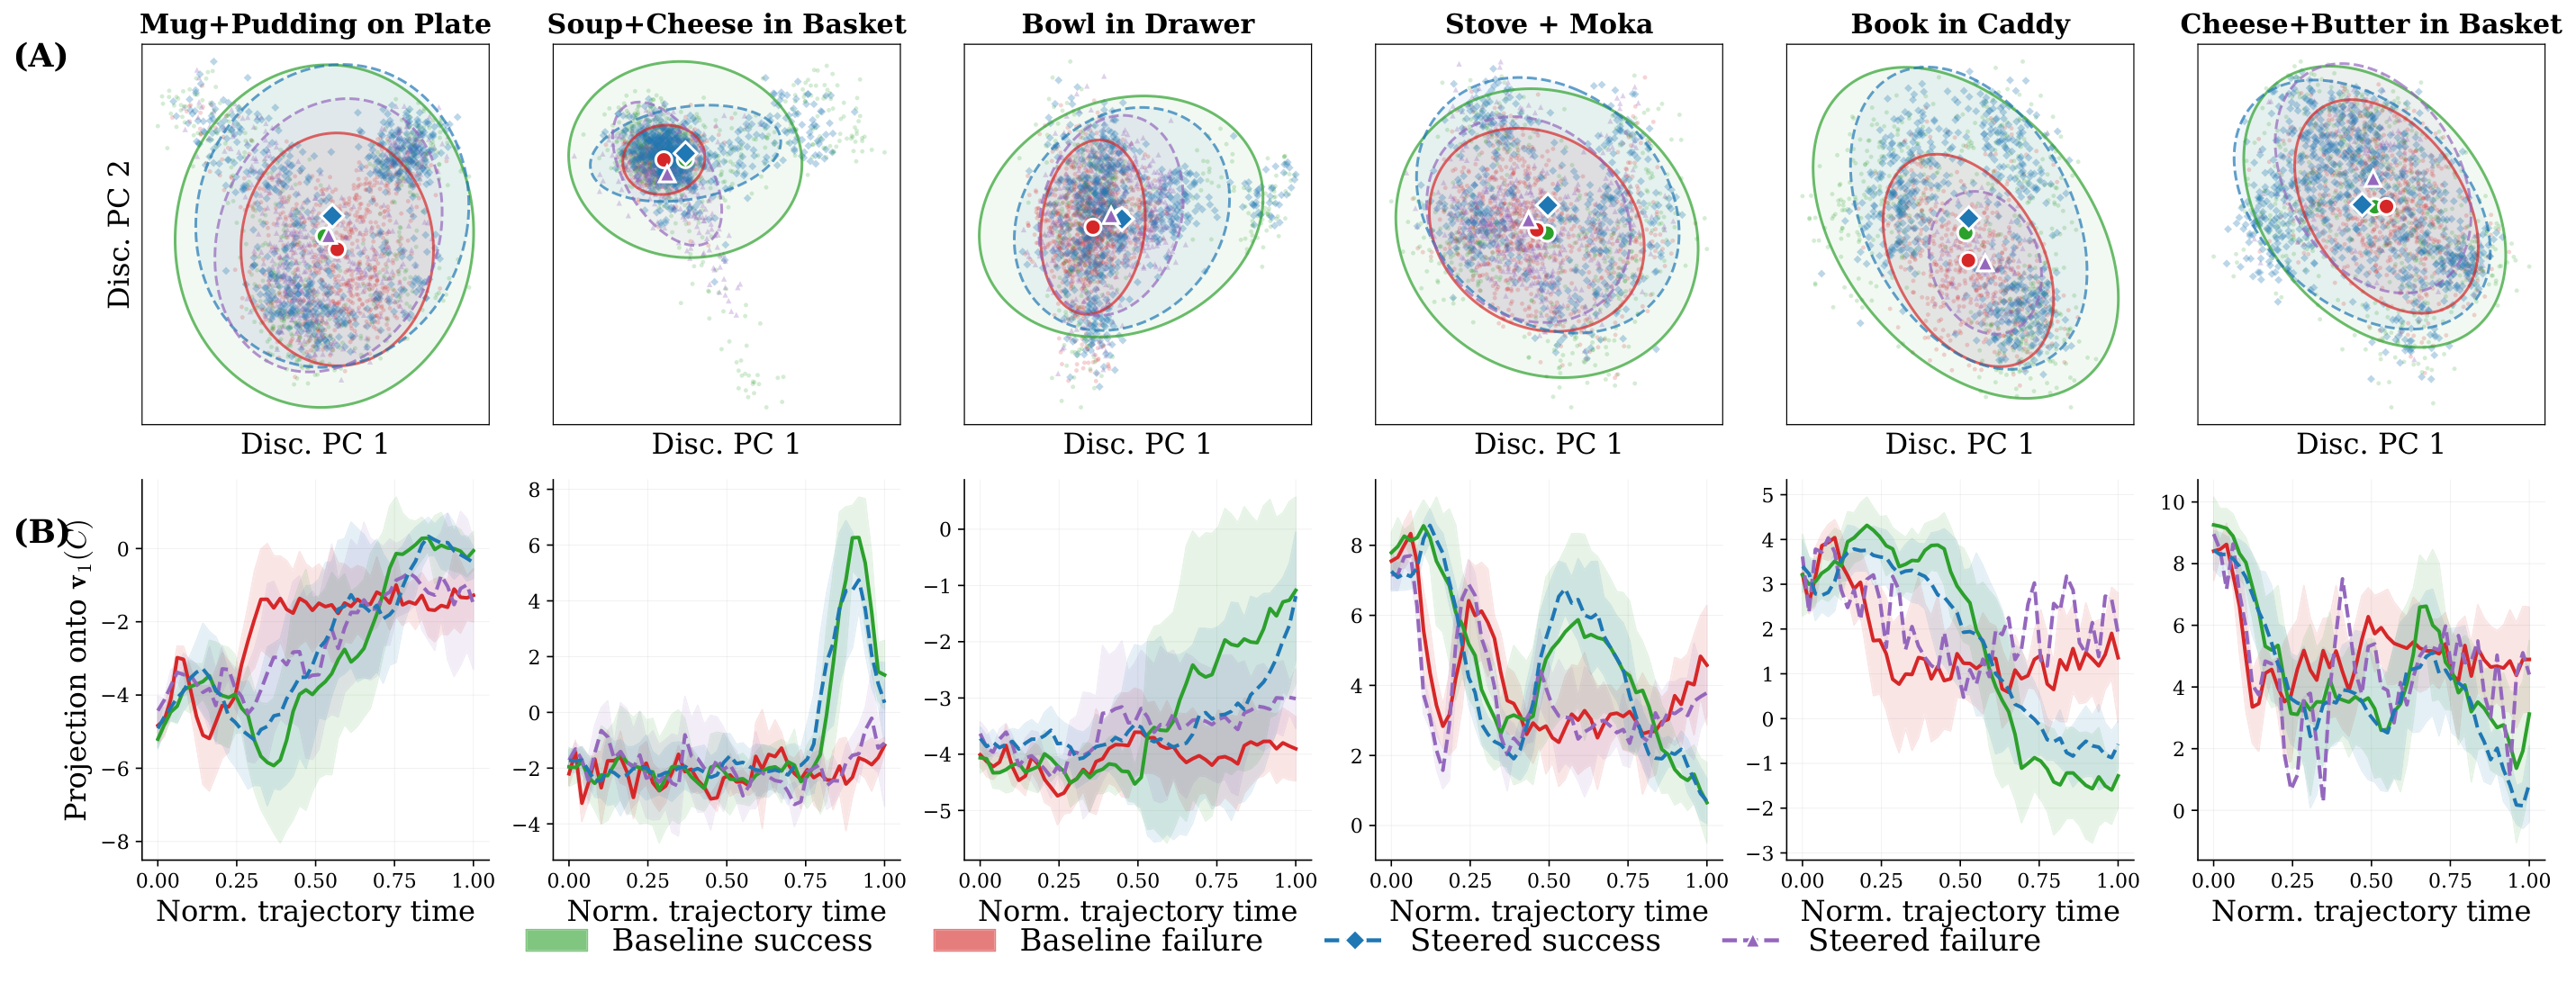
The key observation is that steered centroids shift toward the baseline-success centroid and away from the baseline-failure centroid. Over trajectory time, steered successes consistently track the baseline-success mean, while steered failures either sustain a partial shift or revert to the baseline-failure trajectory. The physical outcome closely tracks which distribution the activations align with, confirming that these regions are linked to task execution rather than merely descriptive.
Tasks Share Failure Geometry, Enabling Cross-Task Steering
Success activations cluster tightly and uniformly across tasks, while failure activations spread into distinct, task-specific regions. Because the contrastive conceptor acts subtractively along failure directions, a conceptor fitted on one source task should also help a different target task whenever their failure subspaces overlap.
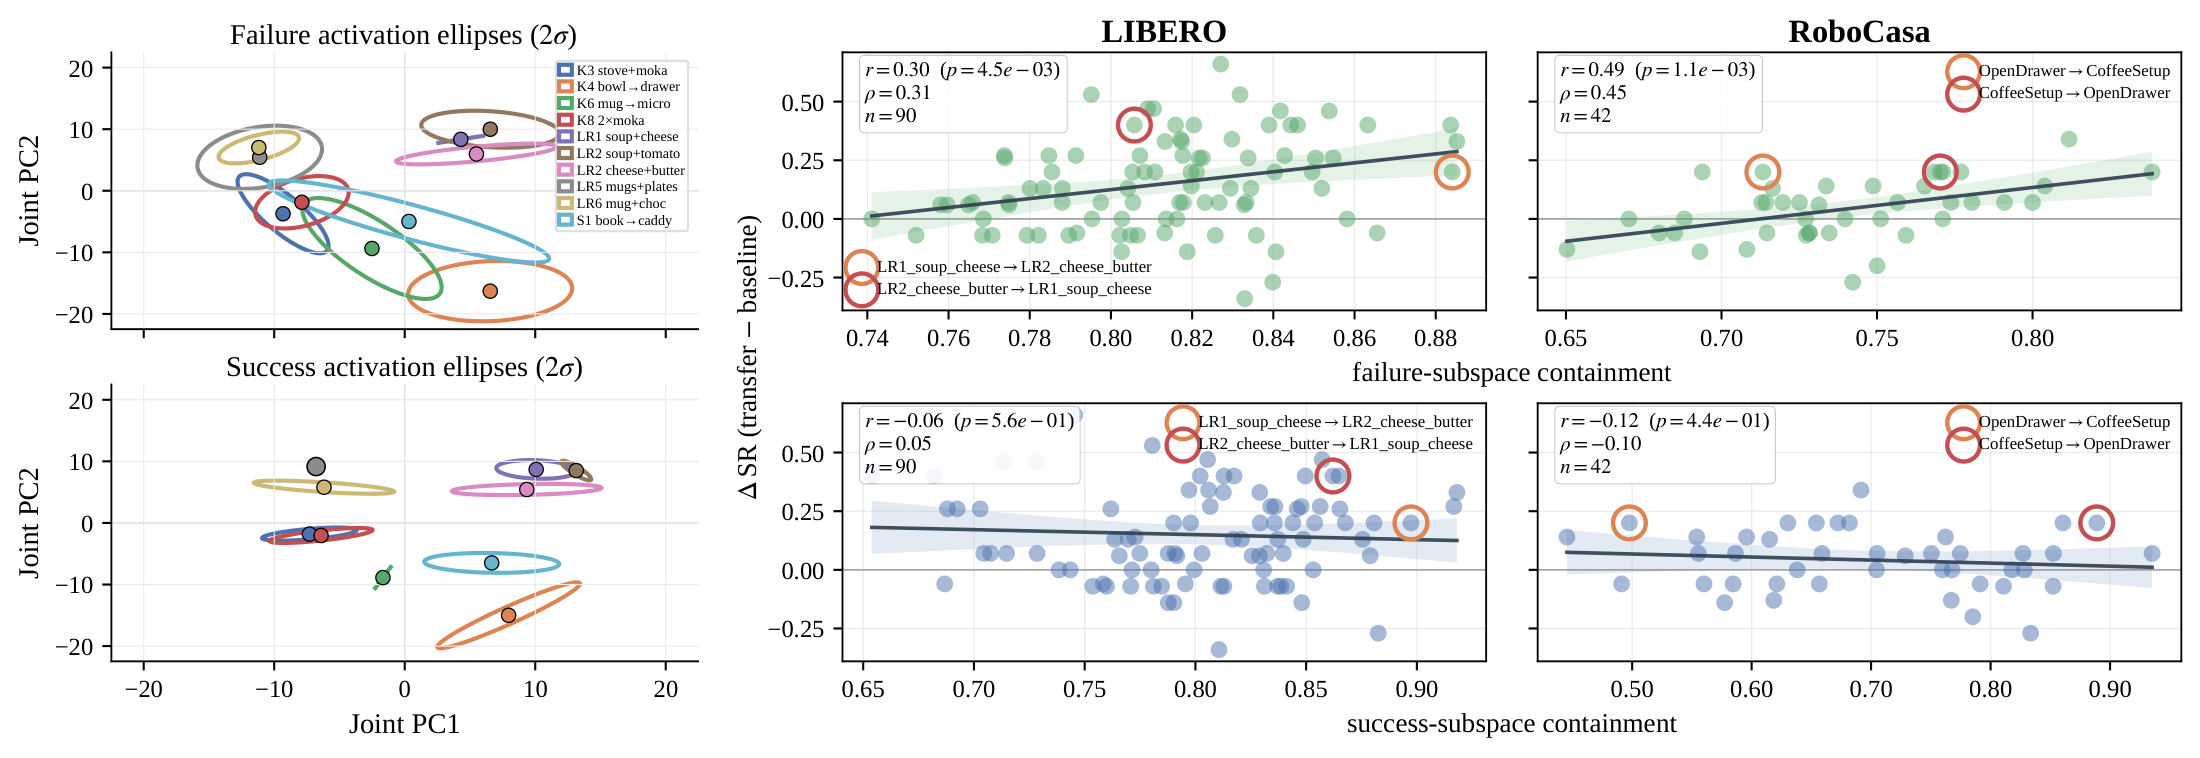
Transferred conceptors retain most of the gain of the self-fit configuration, and in several cases match or exceed it. On LIBERO, a conceptor fit on Mug+Micro lifts Cheese+Butter by +0.80, and on RoboCasa a Coffee Setup conceptor lifts Open Drawer by +0.60, both without any refitting on the target task. Shared failure structure, not shared success structure, drives these gains.